As more and more organization are moving to the cloud on the conferences I have been and with clients I have discussed, I hear quite often that they experience SharePoint performance problems or SharePoint slow responds back, either the page loads to slow, either it happens regularly during the day for no visible reason. It just happens sometimes, it is there for a day or two and then it suddenly disappears and then suddenly it is back. And it is frustrating because by the time you start troubleshooting the issue may go away.
When you troubleshoot on-prem environment it is quite easy sometimes. You know how the SharePoint farm looks like, it is always the same set of a different servers. We have web front servers where users are consuming content and connecting, we have application servers where your important services are running, and you have back-end SQL servers where all the data gets stored. If on-premises is slow you will monitor all server roles, the network and then you will figure out that your CPU is under heavy load, you have assigned too few memory resources or just underlying storage system is slow and SharePoint page loading for the end users appear slow.
In the Office 365 cloud the situation is completely different – you do not have control over the resources, you can control just how the environment will look like logically, e.g. how many site collections you will have, subsites, permissions etc.
You don’t know how many WFE servers you have in the Office 365 cloud, how many application servers are running in the background and if the SQL database is on the shared machine, how many RAM you have on it and how many end users that SQL box is hosting and if it a shared or dedicated instance.
SharePoint Online is built with multitenancy in mind from the scratch. There is a reference on the Microsoft docs on how to build SharePoint farm that is fictionally built for 300.000 users.
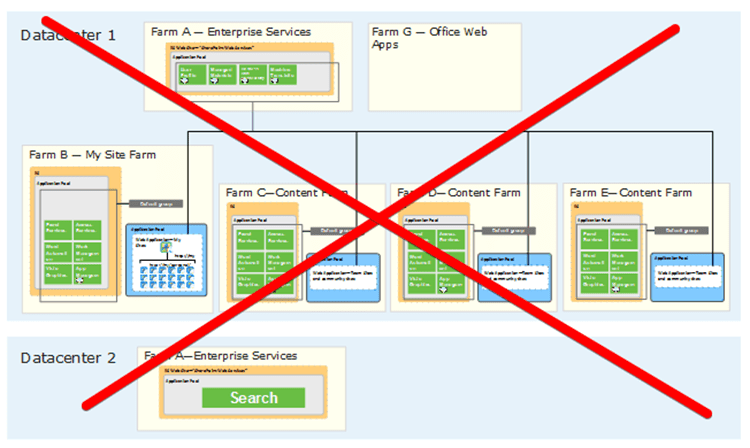
This is not your SharePoint Online farm, well the design is quite similar, but everything is built on the completely different scale. You don’t have 10 WFE servers, you have hundreds of those, you have HA (between multiple farms), you have redundancy across different GEO located data center and the bottom line would be it is built on way larger scale then the on-premises SharePoint farms.
The load testing of the SharePoint Online tenant is prohibited as per this article: https://docs.microsoft.com/en-us/office365/enterprise/capacity-planning-and-load-testing-sharepoint-online
All the results you might get from the load testing are temporary and you cannot use them as a reference because the results may vary a lot. You probably heard quite a few times that Microsoft is automatically throttling load tests meaning that the results are not real and might mislead you.
So, the approach to the SharePoint online monitoring will be completely different. We will use a set of tools (mainly browser) that will be able to extract information from the end user’s perspective and we will try to extract some valuable data from those numbers that will help us lead in the right direction to detect what could possibly go on.
How SharePoint Online is delivered to you and your end users
I will just briefly explain how SharePoint Online works in the backend network and how content gets delivered to the users that are sitting in different GEO regions.
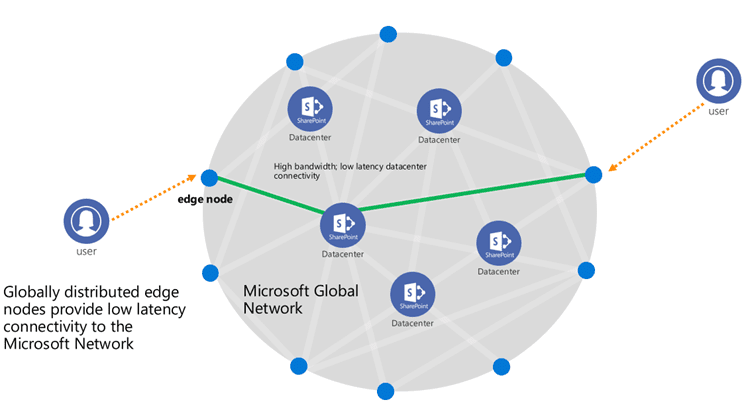
This picture represents how is Microsoft globally through the Azure network bringing SharePoint online to you.
So this effectively means that Azure traffic between the datacenter stays on the Microsoft network and does not flow over the internet. You first connect to the edge node and then from the edge node you go in the Azure network where Microsoft routes your request thru the ultra-fast, ultra-reliable Microsoft global network. Microsoft has invested in the dark fiber and in last three years the Microsoft long -haul WAN capacity by 700 percent.
Fact: Microsoft owns and runs one of the largest WAN backbones in the world.
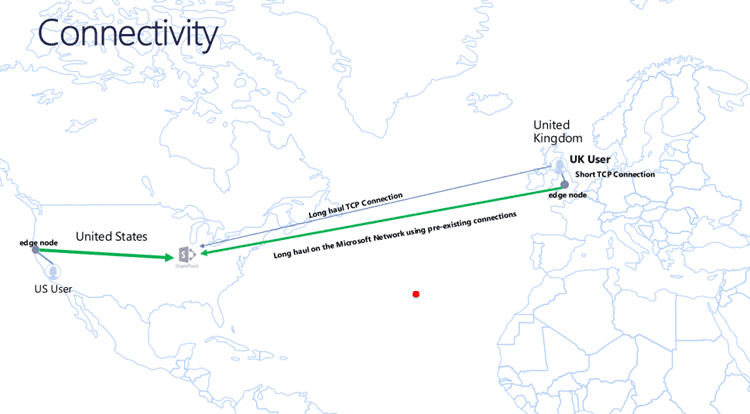
The image below will illustrate how two users are connecting from the end-point over the edge node to the Azure network and then to the destitution inside the Azure network.
US user who is sitting in San Diego will connect first to the edge node in Los Angeles and then thru ultra fast Azure internal network will continue to the destination farm sitting in North Central US data center.
The UK user will not go thru the long-haul TCP connection over the Atlantic Ocean, rather the user will connect to the edge node in London and then thru the Microsoft Azure network it will access the North Central US data center and your SharePoint Online site living there.
It is important to mention that Azure traffic is not flowing thru the public WAN but always stays within the Azure network. All the Azure traffic between the WFE, APP, Search and all that between the SQL servers always stays on the Microsoft private Azure network, regardless of the source and destination region.
Troubleshooting with Chrome DevTools
For the troubleshooting I will use Google Chrome. Most of the browsers today have the developer console where you can check the details that will be important for troubleshooting why SharePoint is slow.
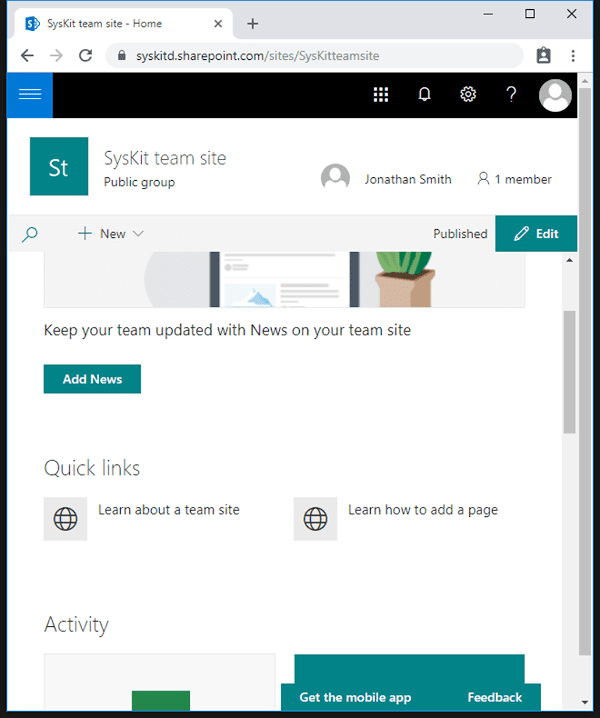
I will use our demo tenant for troubleshooting and it looks like this:
On the Google Chrome the DevTools are activated with F12 like with the most modern browsers.
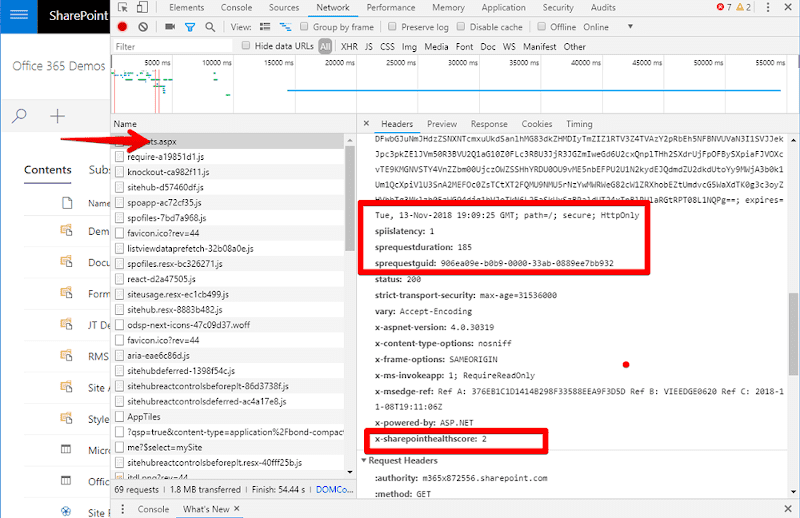
When you press the F12 you need to go to the network tab. When you are on the network tab press ctrl + f5 to reload the page. Now the key here is to select first aspx page because that is the SharePoint page that will show us the data that is important for troubleshooting. When you select SharePoint aspx page in the right window where the headers are you need to scroll a bit below where you will find the headers that we want.
The names are and short explanations:
- Spiislatency – is the time in milliseconds taken in the front-end Web server after the request has been received the front-end Web server, but before the Web Application begins processing the request. This value should be around 0 or 1 or very close to that numbers. I have seen this request spikes to the two digit numbers but very rare or in one request and then goes back to the single digit numbers.
- Sprequestduration – is the time in milliseconds that took to process the request on the server. So bottom line is this is the end to end processing time for the SharePoint page. Healthy pages have couple of hunderds for this number so in a range from 100-500ms, if it is larger than that you might experience some issues. If this number is high the last number x-sharepointhealthscore will be high as well.
- Sprequestguid – this is basically correlation ID and we will use it for troubleshooting if we need to report slowness to the Microsoft. This ID will be required by the Microsoft support, because otherwise SharePoint online is slow doesn’t work for them
- x-sharepointhealthscore – this is the indication of how heavily loaded is SharePoint from which your request came. The value for this is from 0 – 10, where 0 or very close to 0 is great, and everything larger then indicates performance problem. If this number is constantly over 5 this is the indication that something bad is going on with the farm where your tenant is any that you need to report this back to the Microsoft.
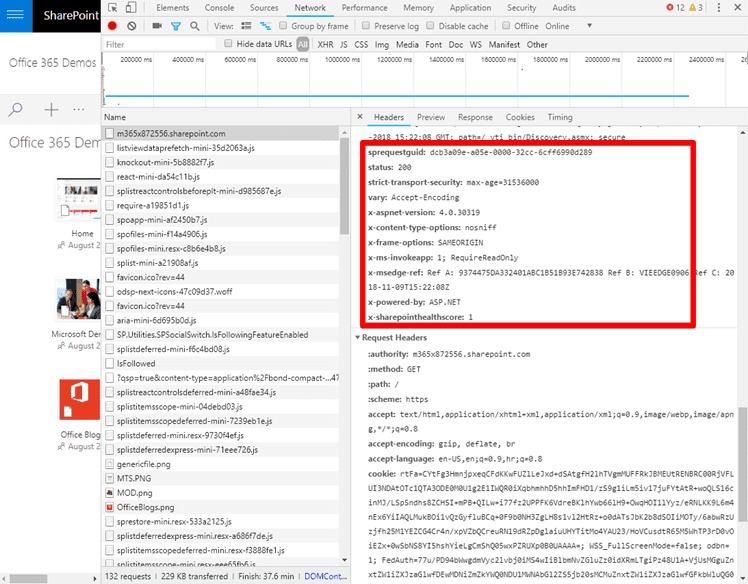
If you don’t see the Spiislatency and Sprequestduration then tough luck, Microsoft disabled this headers in order to aggravate your troubleshooting 😉 Just kidding if you don’t see this headers we will describe down below on how to extract it if you don’t see it. Just for some SharePoint Online tenants this numbers are not visible, and you need to do extra steps in order to extract the numbers.
So sometimes these headers and on some tenants are not available and the headers look like this. To be honest on the test tenants I have some have these headers some don’t. Why this happens we don’t know and there are numerous articles on the web that a lot of people noticed the same. Probably in the future this will be consistent, until then you have a solution on the end of the article that you can check out later.
Page Diagnostics for SharePoint
Page diagnostics is a Chrome extension that can be installed from the web store to troubleshoot your SharePoint Online pages. You can download it from here.
Page Diagnostics for SharePoint is a simple to use tool that can be installed in the browser and can provide you simple basic troubleshooting for your slow SharePoint sites. Hopefully Microsoft in the future will expand the use cases for the tool.
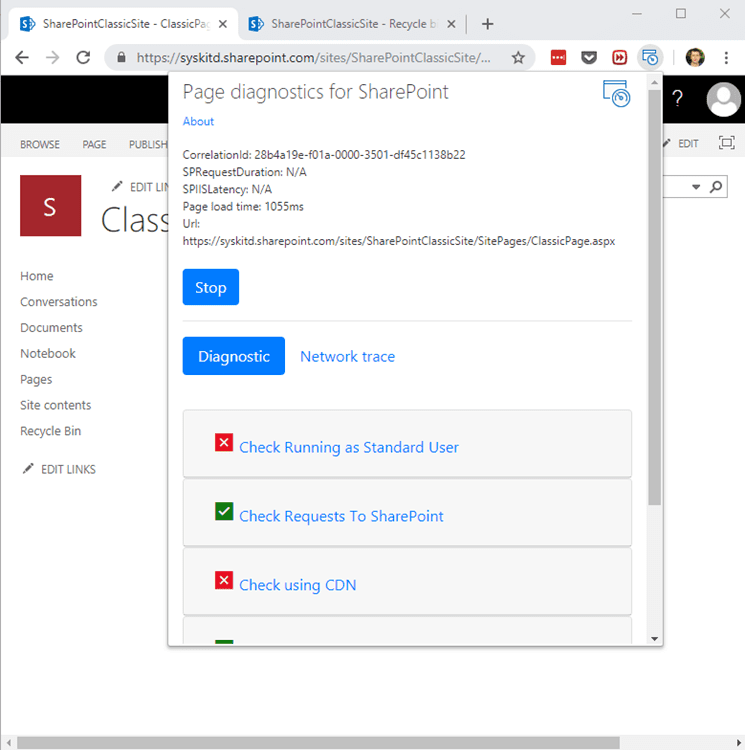
The has very limited use case but it will help you troubleshoot:
- Non-SharePoint system pages like allitems.aspx, it will run on the Site pages
- It runs on the classic sites now (hopefully modern will be added sometime)
Main things this Chrome extension checks are:
- Check Running as Standard User (non Site Collection Administrator, Site Owner, Editor, or Contributor) https://go.microsoft.com/fwlink/?linkid=873252
- Check Requests to SharePoint (minimize number of network requests to SharePoint Online!)
- Check using CDNs (CDNs to improve download speed) https://go.microsoft.com/fwlink/?linkid=873250
- Check for Large Image Sizes (optimize images, use image compression and optimization techniques) https://go.microsoft.com/fwlink/?linkid=873251
- Check for Structural Navigation (the most common and has the most impact on the performance, depends on how many site you have and how deep are they!) https://go.microsoft.com/fwlink/?linkid=873247
- Check for Content Query Web Parts (replace the Content Query Web Part with the Content Search Web Part) https://go.microsoft.com/fwlink/?linkid=873245
Please note: Page Diagnostics Tool for SharePoint extracts the headers SPRequestDuration and SPIISLatency from the SharePoint Online page. If this two headers are empty then unfortunately this values are not available thru the standard APIs in your tenant. More on the solution on the end of the article.
SysKit Insights
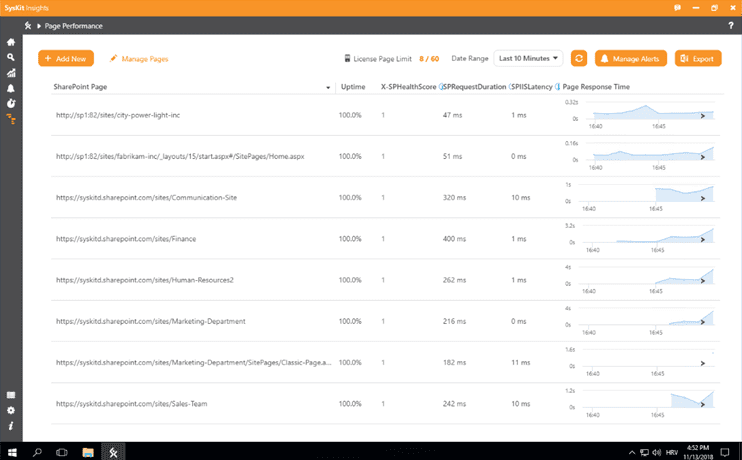
With this being said I am proud I was part of the team who built tool that will basically allow you to detect if your SharePoint slow to respond. We managed to built even engine the extracts SPRequestDuration and SPIISLatency when those are not available like on some SharePoint tenants or SharePoint modern sites.
The solution is capable out of the box of reading following metrics:
- Uptime of the web page
- X-SPHealthScore
- SPRequestDuration
- SPIISLatency
- Page Response Time or how much SharePoint page takes to load
The following environments are currently supported :
- SharePoint Online modern and classic sites
- All SharePoint on premise environments from 2010-2016
- SharePoint 2019 classic and modern sites
On top of this metrics the tools will provide a file request drill down and how much each request and the file took to load. If there are huge background images you will be first to know.
If you need to report back to Microsoft the corellationID for the troubleshooting (or so called SPRequestGuid) the tool will extract it for you, so you can report it to Microsoft for easier troubleshooting of the issue. To check out the tool click here: https://www.syskit.com/products/insights/download/
How is your experience with the SharePoint Online slowness troubleshooting? What tools do you use? Leave in comments below I am quite interested in understanding this patterns in the SharePoint Online.
